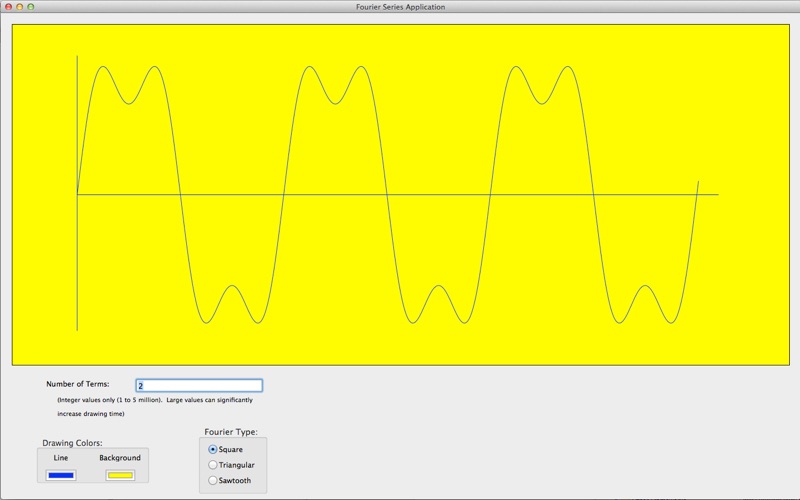
A Fourier Series and Computational Benchmark
Jean Baptiste Joseph Fourier (1768-1830) was a physicist and mathematician who, among many other accomplishments, hypothesized that any periodic waveform could be generated by summing up the harmonics of sine waves. That meant that square waves, triangular waves, saw-tooth waves and more can be generated by adding together the components of the right blend of sine wave harmonics. The “right blend” of components is expressed as a mathematical series named a Fourier Series.
With a Fourier series describing a waveform, manipulating the number of harmonic terms to be added defines the shape of the final waveform. Thus, one harmonic produces a simple sine wave. As the number of harmonics increases, the output shape becomes more and more exact. For example, use two harmonics in a Fourier series for a square wave and you can begin to see the waveform take shape. Use 300,000 terms and, for the pixel resolution of most monitors, you will arrive at a perfect square waveform.
Each pixel in a Fourier plot is a result of adding the number of harmonic terms desired. Thus, a Fourier series can also be a relative measure of the computational and graphical power of a computer.
Imagine that a Fourier plot consists of 1000 horizontal points. If you ask for a Fourier plot that includes 2000 harmonics, then:
1000 x 2000 = 2,000,000 mathematical
calculations are made
In other words, for each point on the plot, 2000 calculations are made and summed together.
Here is the simplified equation for the first four terms, for each point in the Fourier series for a square wave.
y(t) = 4/π [ sin(2πx) + 1/3 sin(6πx) +
1/5 sin(10πx) + 1/7 sin(14πx)…]
More powerful computers make the calculations faster. Compare the relative speed of two computers by plotting the same waveform on both.
